Over the past couple months, we’ve had several clients ask questions about why the investment returns for their portfolios over the past year were lower than those of “the market,” as projected in the media. The problem is that when reporting on the stock market, the media often uses an index such as the S&P 500 or the Dow Jones Industrial Average (DJIA) as a proxy for the market as a whole. This is misleading if you consider that the S&P includes only 500 U.S. large companies and the DJIA includes only 30 U.S. large companies. Investors with a diversified portfolio of DFA mutual funds generally hold shares in over 12,000 stocks around the globe. In other words, they hold approximately 24 times the number of stocks in the S&P 500 and 400 times the number of stocks in the Dow Jones Industrial Average. (Granted, the 500 companies in the S&P 500 represent a greater proportion of market capitalization than 1/24th of the global stock market, but still, you get the idea.) With 11,500+ other stocks in one’s portfolio, in addition to the 500 companies in the S&P index, your portfolio returns will often diverge from the popularly-cited proxies for “the market.”
Furthermore, as mentioned above, those indices only track U.S. large company stocks, i.e. 1 out of the 10 asset classes that we would generally recommend to maintain a diversified portfolio. They do not include U.S. small company stocks, international stocks, emerging market stocks, etc. Therefore, while comparing the returns of the S&P 500 to a fully diversified portfolio might be useful as a frame of reference, it is a misnomer to call the S&P 500 a benchmark for that portfolio. That would be comparing apples to oranges. Or, rather, comparing an apple to a basket of 10 fruits that includes an apple but also includes 9 other fruits that look very different from an apple.
Why Not Have a Basket of Just Apples? A natural follow-up question might be: Why should I have a fully diversified portfolio if I would obtain better returns from just investing in the S&P 500? And certainly if U.S. large company stocks consistently outperformed every other asset class, any honest fiduciary would have to recommend just that. However, that is not the case.
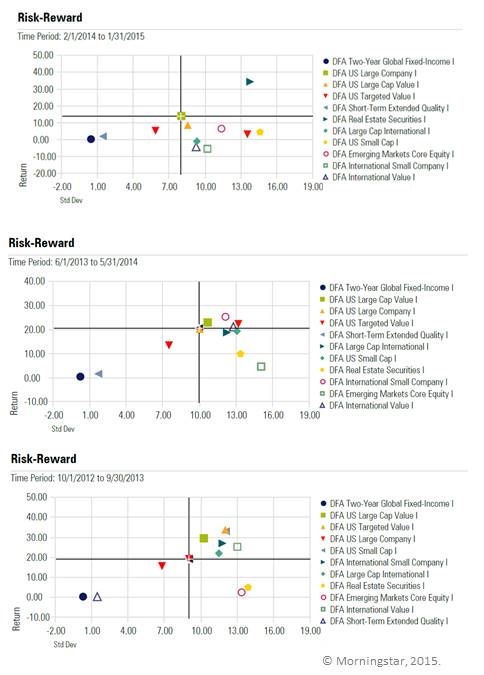
In 2014, U.S. large company stocks were one of the best performing asset classes, with the S&P 500 gaining 11.4% over the year, while U.S. small company stocks provided much lower returns (Russell 2000 increased only by 3.5%), and international stocks actually had negative returns (Dow Jones Global Ex-US Index decreased by 5.5%). However, U.S. large stocks did not perform as well as real estate (as measured by Dow Jones Select REIT Index), which gained over 27% in 2014, after producing negative returns in 2013. Which asset class has performed the best over the preceding 12 months changes frequently, as evidenced by the charts to the left (showing asset class investment returns relative to the S&P 500 for 12-month periods ending January 2015, May 2014, and September 2013).
The symbols (representing DFA mutual funds for each of the different asset classes) move above and below the horizontal line (representing the annual return for the S&P 500) over time. As Mike likes to point out, we like all of those symbols. We do not know which symbols will be above the line for the year ahead (and academic research suggests that it is counterproductive to guess through active investing), so we remain invested in all of them. The benefits of diversification to reduce risk and improve investment performance over time have been well-established, so don’t bet your life savings on a basket of apples.
If you have any questions about your financial future, we're here to help. Please use this form or feel free to call or e-mail us.
(703) 385-0870


